


I love teaching math! Teaching graphing and data analysis is no exception. The graphing in math lessons is so visual and hands on which always leads to student engagement. PLUS graphing is such an important skill in upper elementary! Interpreting data and graphing is a real life math skill students will need to build upon throughout school and in their adult life. I have made it a mission of mine to make my graphing unit jam packed full of hands on activities. This blog post will have teaching ideas for picture graphs or pictographs, bar graphs and line plots with a fun freebie at the end!
Teaching Graphing in Math: The Basics
Students need to know the purpose of graphs. People use graphs to be able to easy display data or information. It’s important to discuss where all students might have seen graphs in the past: reading books, science class, YouTube videos, etc. There are many different types of graphs, but these are the most common. So we focus our limited instruction time on these. Keep reading to find out how to get this graphing anchor chart for free!

Graphing Vocabulary: Pictographs, Bar Graphs, Line Plots
Pictograph: a type of graph with a symbol to show how much data is in each category. Pictographs show numbers or quantities in pictures or symbols so they can be easily compared.
Key: a data box that describes labels
Data: the information that is represented on a graph
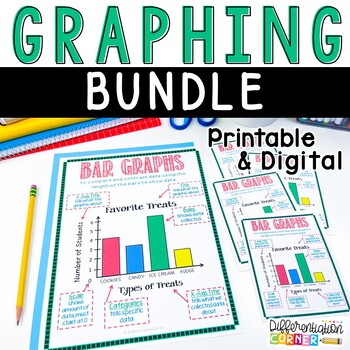
Bar Graph: shows 2 or more groups of data so they can be easily compared. The bars can be vertical or horizontal.
Scale: shows the amount of data per interval
Labels: categories that show what each data set stands for
Line Plot: a type of graph that shows how frequently something occurs by displaying the data as points above a number line.
Picture Graphs, Pictographs or Pictograms
We start with pictographs. You might call them picture graphs. Students are familiar with these types of basic graphs from previous grades. But pictographs in 3rd grade & 4th grade are more intense. The symbols can represent more than 1 now, so your math students will need to carefully interpret pictographs by looking at the key. Students will also be asked to interpret picture graphs with two step questions.
I have students glue this pictograph anchor chart into their math notebooks. It tells each part of a pictograph and reminds them to look at the key. I also print a larger anchor chart out to use for my graphing math centers.


Bar Graphs
Bar graphs are similar to pictographs because they compare data and should be familiar to students by 3rd and 4th grade. In upper elementary, your math students will be asked to interpret these graphs with more complex questions and the scales of the bar graphs will be in greater increments than before.
I have students glue a small bar graph anchor chart into their math notebook and I place a large copy of the anchor chart near my math centers. This bar graph anchor chart is a great reference tool for students to use for independent work.

Bar graphs are great for simple student surveys. You can interview your class about their favorite pets, flavors of ice cream, pizza toppings, or favorite games to play at recess. Then create a class graph on chart paper and let students make observations. Here’s more on how I teach bar graphs in 3rd & 4th grade.

Line Plots
Line plots can also be called dot plots and are super tricky for students in our graphing in math unit. These more advanced graphs can be tricky for students to master! I start out using whole numbers on a simple line plot where the data points represent one. As students learn more about them, we create more complex line plots with larger numbers and fractions. I print out a large copy of this line plot anchor chart and students glue a smaller copy into their math notebooks.

The best way to teach line plots to 3rd and 4th graders is to involve them in creating them. The more they plot data on number lines and create line plots, the more they will understand how to interpret data on them. Hands on graphing activities in math are really the way to teach these tricky line plots! If you’d like more on how I teach line plots in 4th grade, click here.

Graphing In Math Activity Ideas
Collect Real Data in the Classroom
- Make bar graphs with reading fluency data once a week with these fluency sentences! Students read for one minute and mark their progress on their chart. I do this as part of my guided reading groups.
- Have students create graphs using their progress learning multiplication facts.
- Have students measure their pencils to the nearest centimeter.
- Head outside and have students do a softball throw. Measure and plot the distances.
- Record the temperature for a set number of time and graph.
- Weigh student backpacks and create a line plot with fractions.
Discuss student observations about each graph or line plot. Let students create questions about the graphs and charts and then get with a partner and swap questions so they can analyze and interpret the data on the graphs.
Graphing Task Cards
These are my favorite math task cards for interpreting data and graphing in math! Task cards can be used SO MANY WAYS in the classroom. And these are no exception! This set covers bar graphs, pictographs, and line plots with fractions.

Google Slides Graphing Freebie
This activity is a perfect introduction to your graphing unit. You can project it on your whiteboard and discuss graphs in math. It would work well for a quick independent assignment, graphing homework, or graphing sub plans.
Click here to grab these FREE Google Slide Graphing Activities and Graphing Anchor Chart!