


Let’s be honest. Teaching graphing can feel like explaining taxes to a toddler. You start strong, full of hope, your colorful markers in hand. You walk your students through a bar graph with enthusiasm. “Look! The data shows that pizza is the most popular lunch choice!” You turn around, expecting nods of understanding, and instead, you get blank stares. Or worse: a student confidently telling you that hot dogs won because they like hot dogs more.
Uggghhhh.
Graphing is a critical skill, but it can be tough for students to grasp. Whether it’s misreading pictographs or struggling to plot points on a line plot, these concepts can leave both you and your students scratching your heads. The good news? There’s a simple way to make graphing click. Let’s talk about it.
Why Do Students Struggle with Graphing?
If you’ve ever had a student try to read a graph upside down on graphing worksheets, you know that graphing in math is not as intuitive as we’d like it to be. Here’s where kids often get stuck:
- Understanding Different Graphs – Some kids think a pictograph is just a cute drawing, while others treat a line plot with fractions like a connect the dots activity.
- Interpreting Data – They either overthink the numbers or ignore them altogether and go with their gut (just like the hot dog debacle). Grab free digital graphing worksheets in this blog post.
- Creating Their Own Graphs – Organizing data? Using a scale? Making sure the bars actually match the numbers? It’s a lot to manage.
That’s why we need a structured, engaging way to help students master graphing without the confusion.
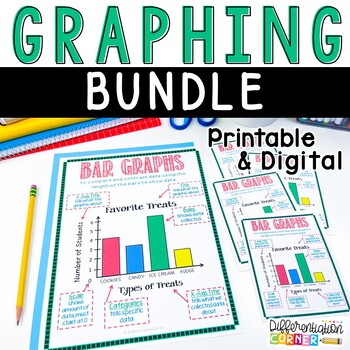
The Solution: No-Prep, Engaging Graphing Worksheets & Activities
Instead of reinventing the wheel or spending hours making your own materials, let’s talk about a resource that takes the stress out of lesson planning and teaching graphing in math. These graphing worksheets and activities provide everything you need to help students understand, interpret, and create graphs – with zero prep.
Here’s how you can use graphing worksheets in your classroom:

Start with Visual Anchor Charts
You know how some students need to see it to believe it? This set of graphing worksheets comes with teaching charts! These graphing anchor charts give them a clear, easy to reference guide for bar graphs, picture graphs, and line plots. You can print them out as a poster to hang on your wall, and they come in a small size ready to use in their interactive notebooks.

Make It Interactive with Graphing Worksheets
Once students see how graphs work, it’s time to practice. These graphing worksheets are designed to meet students where they are, whether they need to interpret existing data or create their own graphs from scratch.
Bar Graph Worksheets – Students answer questions and make their own graphs. More about teaching bar graphs in this post.
Pictograph Worksheets – They learn how to decode those sneaky little symbols that sometimes represent more than one thing.
Line Plots with Fractions – Because why not throw fractions into the mix? Don’t worry, these worksheets make it simple.
Easy Implementation Tip: Use the “make your own” graphing worksheets as an assessment. This way, students can show what they’ve learned, and you get a quick assessment for reteaching groups.

Go Digital with Graphing on Google Slides
If your students love technology or you’re just tired of making copies, these graphing worksheets are also available in digital format.
Use the teaching slides for whole group lessons and the interactive graphing worksheets for whole group practice examples.
Google Slides version of every worksheet and anchor chart.
Answer keys included because you deserve easy grading.
Works with multiple platforms like Seesaw, Nearpod, and more.
Easy implementation tip: Assign digital graphing activities for morning work or math centers. No paper, no prep, no problem!

Why This Resource is a Game-Changer
Saves you time – No more searching for last minute graphing activities.
Engages students – Colorful, interactive, and easy to follow
Works for all learners – Differentiated worksheets mean every student gets what they need.
Common Core aligned – So you can check that box and move on with your life

But don’t just take my word for it. Teachers using this resource have said things like:
Jason B. says “Good resource for students to learn about the parts of different types of graphs, answer questions using graphs, and create their own graphs. Will continue to use this resource in my classroom.”
Staci F. says “These graphs were great to use during our Graphing Unit last spring. The color and topics made the assignments engaging to the students, and I was thrilled I didn’t have to create them myself. I was glad that this resource had a variety of graphs to choose from too.”
Lindsey L. says “My students find this very user friendly, as do I. Teaching pictographs and bar graphs during distance learning was a bit daunting, but this resource is AMAZING. It gives the students an opportunity to interpret graphs as well as create their own. It was easy to create video lessons and walk them through the process by doing example graphs as there are many for each type of graph.”
Renee F. says “This was wonderful. Easy to use and hit all that I needed it to for the different graphs”
Meghan N. says “Lots of ways to use – can use the different slides to differentiate as well.”
Make Graphing Click for Your Students Without the Extra Work
Teaching graphing doesnt have to feel chaotic or like explaining taxes. With these graphing worksheets and activities, your students will gain confidence in reading, analyzing, and creating graphs.
Ready to make teaching graphing in math a breeze? Grab your set now!